How to Use Fluentd and Loki to Access Service Logs
Traducciones al EspañolEstamos traduciendo nuestros guías y tutoriales al Español. Es posible que usted esté viendo una traducción generada automáticamente. Estamos trabajando con traductores profesionales para verificar las traducciones de nuestro sitio web. Este proyecto es un trabajo en curso.
Fluentd and Loki are part of a flexible chain of service-logging apps. When combined with Prometheus and Grafana, they create a full stack for log presentation and querying. The Fluentd/Loki/Prometheus/Grafana stack is widely adopted and provides decision support using time series-based log data and streams from various log formats. This stack can scale when an instance or pod deployment configuration changes, and also works with Kubernetes components for cloud-native stack control through our Marketplace Prometheus & Grafana deployment.
This log aggregation and console framework is built from established system log sources, or adapted as needed. This approach helps avoid vendor lock-in due to the popularity and independence of separate product developer communities. Its modular architecture is well-suited for the log monitoring and trend analysis visualization needs of system administrators.
This toolkit captures a wide variety of service logs from diverse instances in single or multi-tenant environments. Adding labels and timestamps to logs allows for rapid correlation across tenants and their instances, which can help with troubleshooting and forensic examination. Grafana visually couples or decouples sources and tenants. Using appended labels, timestamps, and time series-based sorting, logs from different components are correlated to each other in the Grafana console. This correlation presents events as a time series-based graph visualization of underlying log streams.
This guide explains how to use Fluentd and Loki to aggregate logs and feeds them to a Prometheus store. Grafana then correlates and visualizes this log data.
Stack Component Relationships
The Fluentd/Loki/Prometheus/Grafana stack provides administrators with a way to visually track error messages. Fluentd aggregates logs from diverse instance sources. Administrative actions and enabled output plugins send data to Loki. Loki then forwards the data to a Prometheus store, which is then visualized through queries made in Grafana. Data sources within a time series can optionally be correlated to other event log message streams for rapid fault determination and forensic study via Grafana.
Fluentd is chosen in this stack for its large number of community-supported source and destination data-handling plugins. These plugins allow for simple customization of source or destination data-handling to or from multiple scalable data streams.
Loki is chosen for its aggregation and timestamping of log sources. Loki receives data from Fluentd, marks it, and pipes its output to Prometheus.
Prometheus and Loki share interchangeable characteristics in log storage, with Prometheus providing a data store that is queried through an open language.
Grafana is used for queries, correlating key values, and identifying trends through statistical or graphical data visualization.
When combined, this stack is lightweight and provides options for auto-start with new Kubernetes instances and pod construction. This allows new deployments and instances to begin reporting log data to the Grafana console immediately. By adding other data sources, the time series-based Prometheus data store enables Grafana to correlate events across a wide instance map. This setup facilitates rapid visual trend analysis.
Administrative uses of Grafana include trend analysis and forensic examination. This leads to improved visibility for communications, general troubleshooting, load balancing, error details, and other trend-related needs.
What Is Fluentd?
The Cloud Native Computing Foundation’s (CNCF) Fluentd is an open source log-aggregation framework with two deployment options: Fluentd and Fluent-bit. Both versions use input plugins to collect logs and output plugins to send the results. The Fluentd binary, written in Ruby, offers more input and output plugin options for differing sources and destinations. The Fluent-bit app, written in C, is a lightweight agent designed for use in virtual machines, containers, pods, and elemental compute sources.
From input plugins, Fluentd and Fluent-bit can optionally filter data fetches. After processing the input stream, they aggregate multiple streams and send them to a target destination. In this guide, the target destination of the multiple log sources is an instance of Loki, via a Ruby gem plugin.
What Are Loki and Prometheus?
Loki is a multi-tenant log aggregation system that serves as the source for data visualization by Grafana. It feeds time-series log data to Prometheus, where the aggregated and timestamped data is stored.
In this example stack, Loki takes logs as input from log streams aggregated by Fluentd, but can also natively handle Kubernetes logs directly. A wider variety of data sources enhances the options available for correlating and visualizing logs in Grafana.
Logs collected by Fluentd can be categorized based on their single or multi-tenancy status. Data from output plugin streams or logs from Fluentd are relabeled and timestamped. Loki then stores this data and serves as the source repository for query and correlation by Grafana, the data presentation layer.
Loki Deployment Modes
There are three deployment modes for Loki:
Monolithic mode: The simplest mode, and the example used in this guide. This mode utilizes a single instance and database stack. Multiple instances of monolithic mode can share a common database instance, permitting horizontal scaling, as queries to any instance accesses the same shared database.
Scalable deployment mode: A more complex mode that separates reads and writes as data flow targets to prevent input host contention, jamming, and possible log loss. In scalable deployment mode, Loki reads and writes from data sources and query tools take separate paths. This deployment requires the installation of a load balancer for Loki write nodes, while all other traffic is sent to read nodes. Designed for terabytes of traffic per day, scalable development mode is for large traffic volumes within a busy framework.
Microservices mode: This mode is tailored for microservices with container fleets, especially those using Kubernetes control planes for pod scaling.
Stack Installation Considerations
Time source: Accurate timestamps within log data sources and consistency in changes made through log aggregation processes are critical for ensuring visualization accuracy later in the stack. All instances, whether log sources or log processors, must be synchronized to the same time source. Use a common NTP server for all instances in the stack to ensure synchronization with this time source and maintain system integrity.
Log and data sources: Fluentd plays a crucial role in the logging stack by accumulating logs from various sources using plugins. For example, log sources could include the
/var/logdirectories on separate Linux instances and a Kubernetes pod. The source of Fluentd logs is limited to the available source plugins provided by Fluentd or created by users. There are numerous input plugins available for various data sources.The gathered Fluentd logs are organized into JSON-formatted entries by Loki. Prometheus stores these Loki logs, which are otherwise ephemeral. The Prometheus store acts as the data source for Grafana’s visualization console. Grafana and Prometheus are typically deployed together. This example uses our Marketplace Prometheus & Grafana installation.
Alternative software configurations: Other configurations use Promtail, Loki, Prometheus, and Grafana either separately or in combination. For instance, Loki, Promtail, and Grafana work well in strictly Kubernetes-sourced log consoles, but have limited plugins for other data sources.
Before You Begin
- Follow the instructions in our Deploy Prometheus and Grafana through the Linode Marketplace guide. Choose the latest available version of Ubuntu. A Nanode 1 GB plan is suitable for this example stack.
sudo. If you’re not familiar with the sudo command, see the
Users and Groups guide.Fluentd Installation
Fluentd gathers log instances via Fluentd and plugins. This example uses a Ruby gem version of Fluentd onto the Prometheus & Grafana Nanode. The commands below install Ruby, along with its development libraries, and Fluentd.
Update and upgrade the Ubuntu system, then restart the Nanode:
sudo apt update && sudo apt upgrade -y && sudo rebootThe instance receives updates and upgrades, then reboots to ensure future revision sync with subsequent items. This is required.
Install Ruby and its development libraries:
sudo apt install ruby-devInstall Fluentd using the Ruby gem without the documentation (to save space on the Nanode):
sudo gem install fluentd --no-docSet up Fluentd by creating a configuration file and directory:
fluentd --setup ./fluentThe configuration file can now be modified to suit input and output plugins.
Installed ./fluent/fluent.conf.Start Fluentd with the configuration file in verbose mode and run it in the background:
fluentd -c ./fluent/fluent.conf -vv &
Loki Installation
The example log monitoring stack uses the same Nanode instance that hosts Fluentd. The plugin that links Loki as the accumulator of Fluentd logs is installed and attached after Fluentd and Loki.
First, download the Debian package from the Grafana Loki Releases page:
wget https://github.com/grafana/loki/releases/download/v3.0.0/logcli_3.0.0_amd64.debInstall Loki on the Ubuntu 22.04 LTS log aggregation instance using
dpkg, the Debian package installer:sudo apt install ./logcli_3.0.0_amd64.debInstall the Ruby gem that links the Fluentd-Loki-Grafana chain together:
sudo fluent-gem install fluent-plugin-grafana-loki
Getting Logs
Fluentd employs a log-scraping agent on each monitored host, and Fluent-bit can also serve as an agent on hosts that require log monitoring. This guide uses the Rsyslog protocol, specified during Fluentd’s configuration, to push logs to Fluentd. Both methods support TLS encryption to secure the network data transmissions against data scraping.
The Fluentd plugin integrates with Loki and directs the log stream to Prometheus, which serves as the data source for queries made by Grafana.
To prevent network data scraping, TLS credentials can also be used to secure network data transmissions between the Fluentd/Loki and the Prometheus/Grafana instances.
Grafana retrieves logs from Loki and queries Prometheus, Fluentd, a private data store, or other sources concurrently by configuring it’s Data Source configuration.
Authentication options for Grafana’s Data Source range from none to TLS Certificates, access secrets, and other forms of Public Key Infrastructure (PKI) techniques. This is necessary to protect other identifiable information in the communication chain from packet sniffing.
Grafana also offers a context-sensitive log query builder. This tool allows you to link common and disparate data sources into a time-series format. You can then use this data for various graphical visualizations, such as histograms, to correlate the query results.
Generating Visualizations
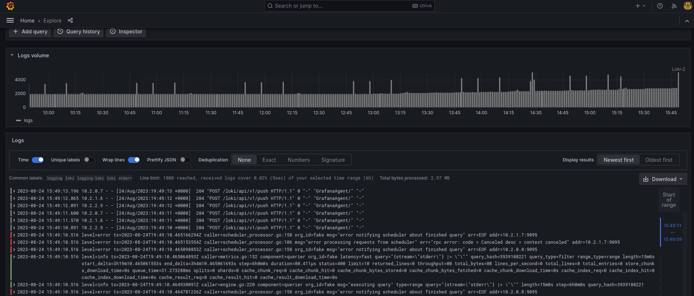
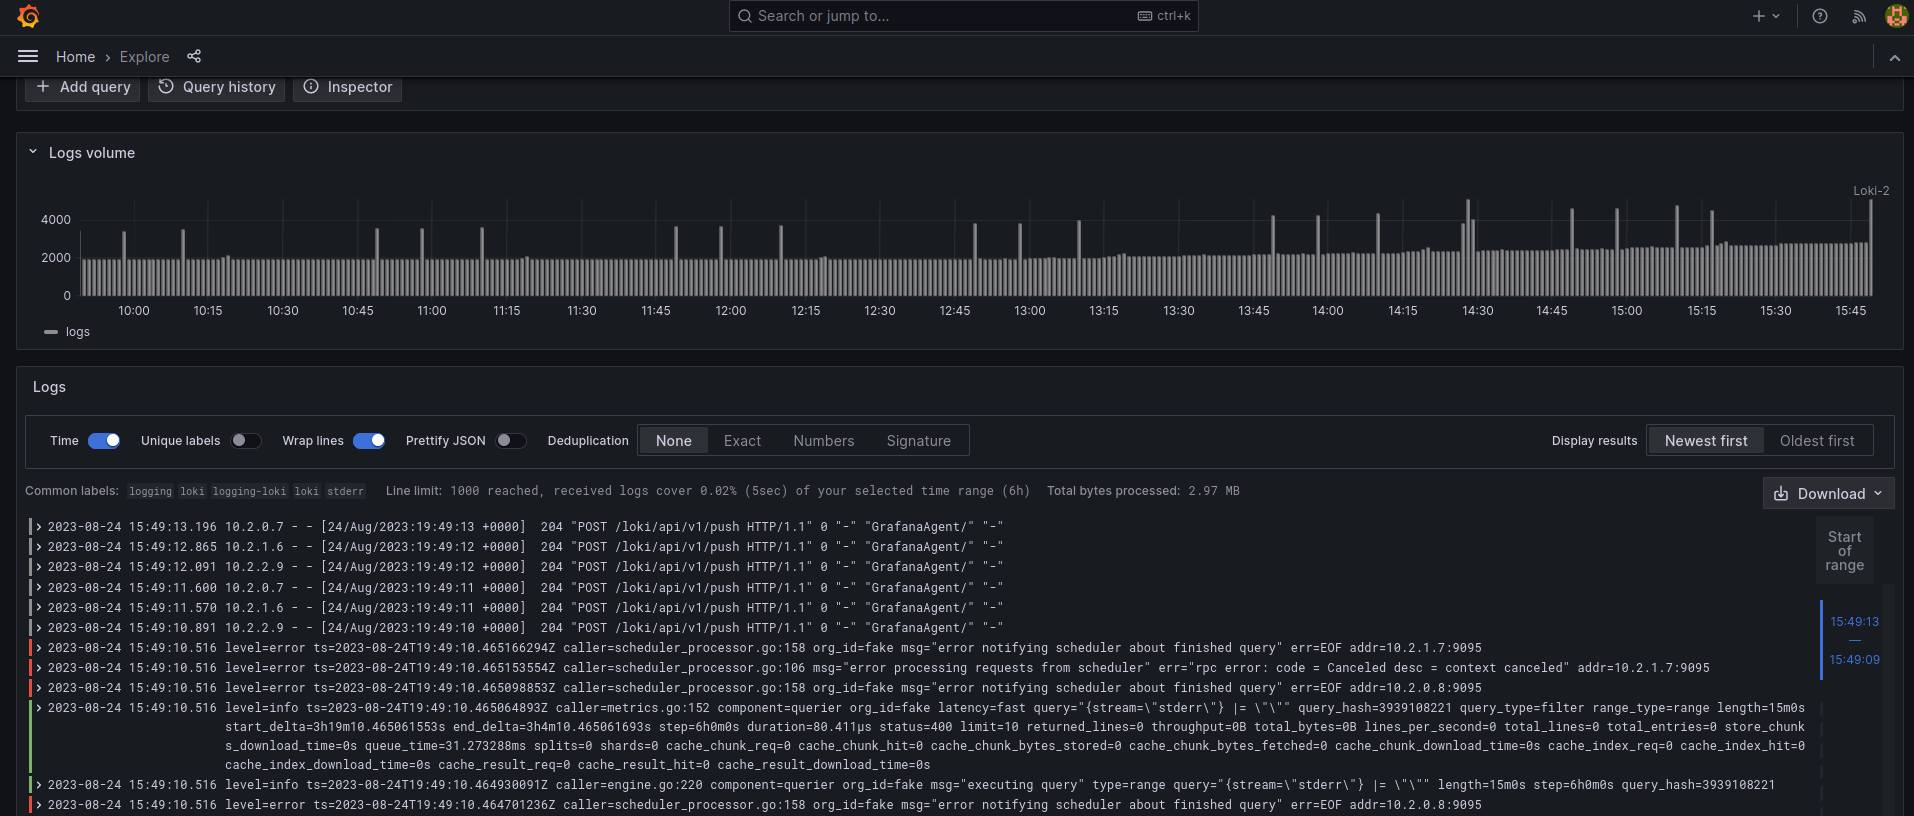
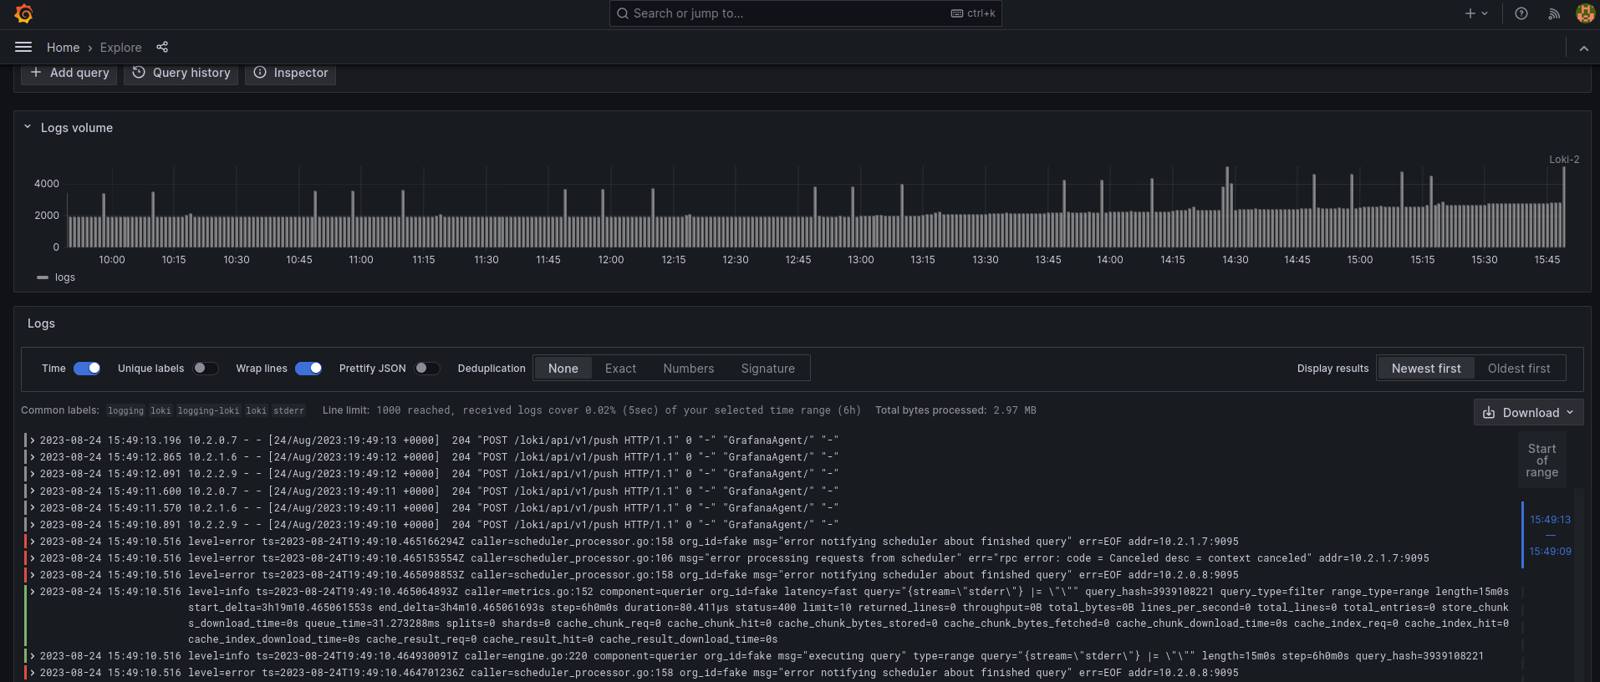
The web browser interface allows you to select specific time frames and fields to generate histograms of log data occurrences. For example, the screenshot below shows traffic sorted by critical messages within a 24-hour time-series across hosts:


These messages are correlated from log sources originating from /var/log/ information across monitored instances and a Kubernetes pod.
More Information
You may wish to consult the following resources for additional information on this topic. While these are provided in the hope that they will be useful, please note that we cannot vouch for the accuracy or timeliness of externally hosted materials.
This page was originally published on

